It’s a problem we as developers face time and time again, it works on my box but for some reason it doesn’t work on the customer’s machine and it’s not reporting anything useful in the error stream.
Maybe we could install Visual Studio on the customer’s machine and run it in debug? Maybe, probably not. Even if the customer lets you it probably involves punting significant chunks of binary around the place, a lengthy install and although Microsoft probably won’t mind as long as you uninstall it when you’re done it probably does violate your Visual Studio licence.
A much lighter alternative is to use the .NET Command Line Debugger. It’s available as part of the Windows SDK which is significantly less hassle to install than VS and far less likely to get you into trouble with the customer or with Microsoft.
The debugger is MDBG.exe and is likely to be in C:\Program Files\Microsoft SDKs\Windows\v7.1\Bin (which you might consider adding to the PATH).
—=== Edit 2013-08-30 ===—
In fact a little research indicates that you can be even more lightweight by installing the relevant parts of the Windows SDK on another box and then just copying Mdbg.exe and MdbgCore.dll to a temporary directory on the target machine.
—=== End of Edit ===—
—=== Edit 2014-11-21 ===—
In an update that could easily be decorated with the attribute [FFS] it appears that mdbg.exe is no longer part of the Windows SDK. Instead it can be found as a “sample debug program”—=== End of Edit ===—
You can load the executable you need on the command line, e.g. C:\Program Files\MyCompany\MyProduct>mdbg MyProduct.exe
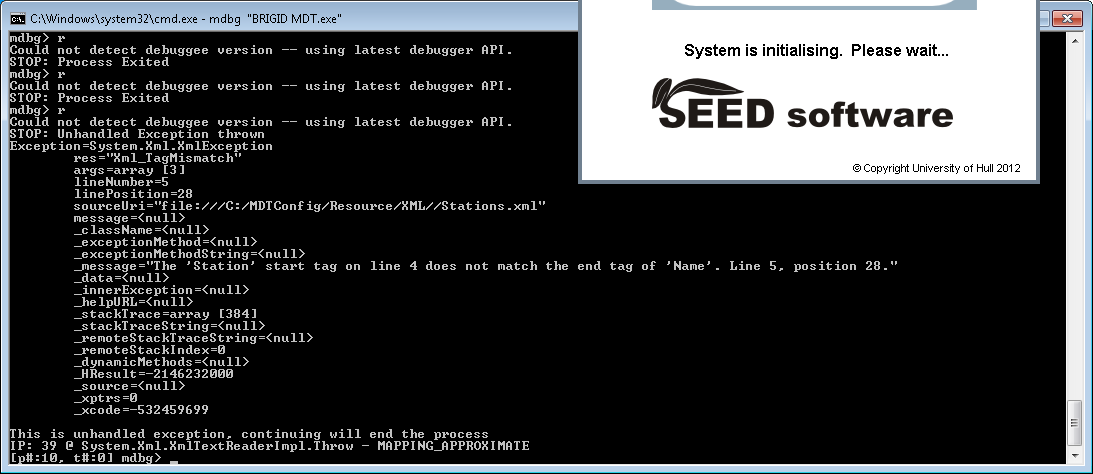
Ah, that’ll be it. I’ve made a typo in one of the XML config files. That’ll be a new item for the backlog then, “Make the app write some useful information to the error stream when some numpty screws up the XML“. It’s fine that it terminates, just not that it gives no reason for terminating.
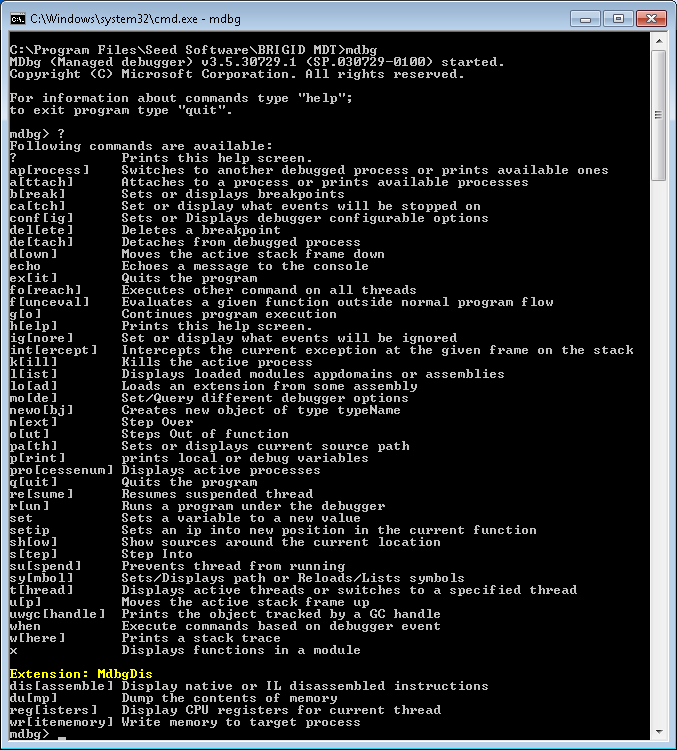
Back on topic, MDBG.exe itself is easy enough to use, it’s even good enough to list its basic usage in response to a ?
Unless you have bundled this debugger with the software surely the least invasive thing would be the equivalent of the old Unix core dump which dumped the contents a process’s memory and the CPU state to a file which could then be analysed later with a debugger, possibly on a different machine.
Does .NET have an equivalent whereby the virtual machine can be told do dump its state on an exception for later analysis?
The quick answer is yes, but no.
As in yes you can get some post-mortem crash information out of Windows but getting anything useful is a different matter. I have seen .NET itself dump the call stack to the event log, but by no means does it do that for every fatal exception. The example I used in the article produced “.NET Runtime version 2.0.50727.5472 – Fatal Execution Engine Error (659CC2EC) (80131506)” and a .wer file that basically just lists the modules that were loaded.
It’s annoyed me since I first started doing Windows development in about 1999 that Windows doesn’t produce anything anywhere near as useful as a core file.
I guess I should also edit the article to add an example of using it to debug a live process rather than to get what was essentially post-mortem information. The point of the article really was to make people aware that it’s possible to debug processes in a much less invasive way than installing VS on the machine where the fault is evident.
I further need to mention SysInternals’ procdump.exe which can be used to dump post-mortem information and is a standalone exe that doesn’t require installation.
Wow, the Visual Studio option was full of probablys 😛